


Document Actions
gvSIG-Desktop 1.9 Alpha. Manual de usuario.
- Simbologia y etiquetado
- Simbología avanzada
- Etiquetado avanzado
- Introducción
- Etiquetado estático
- Etiquetado avanzado (definido por el usuario)
- Introducción
- Etiquetar todas las entidades de la misma manera
- Etiquetar sólo cuando las entidades estén seleccionadas
- Definir diferentes clases de entidades y etiquetarlas de manera diferente
- Opciones comunes
- Etiquetado individual
Simbologia y etiquetado
Simbología avanzada
Introducción
It is a tool which allows thematic cartography to be carried out with relative ease.
You can choose the colour, mesh etc. which most appropriately symbolises or represents the data or variables of the elements to a layer.
To access the edit option of properties related to the symbology you must go to the “Properties” menu (click on the smaller button on the layer).
Another window will open, place the cursor on the “'tables of symbols' tab".
Tipos de leyendas
Introducción
In this tab you can define, in an advanced manner, the type of legend with which you want to represent the data of layer, from its fields [1].
[1]: It must be noted that you can not use the fields resulting from a join to make legend classifications, meaning that, to use these fields in a legend you will have to export the shp resulting from the join.
You can choose the following forms of representation:
Cantidades
Four types of legends can be found:
Point density
Defines a legend of a point density based on the value of a certain field.
Labelling field A drop-down menu opens where you can choose fields from the table (Double or Integer types) from which you can make a legend which represents the quantity of each value in the table. The properties of the points which represent the density of the values in the table can be changed.
- Point size: Use the arrow to change size of the point.
Point value: This is the numeric value which will be given to each point that is drawn.
- Colour: Choose the colour of the point by clicking on the button located right of the colour.
- Background colour: Choose the background colour.
- Outline: Click on this button if you want to give an outline to the symbol.
Intervals
This type of legend represents the elements of a layer using a range of colours. The gaps or graduated colours are mainly used to represent numeric data which have progression or range of values, such as population, temperature, etc.
Classification field: A drop-down menu where you can chose the attributes of the layer for which you want to make the classification for. The field must be numerical as it is a gradual classification (by the rank of the value)
- Interval type: There are three types of intervals from which to choose. These are:
- Same intervals: Calculate same intervals from values which can be found in the chosen field to make the selection.
- Natural intervals: The number of intervals are specified and the sample of this number is divided into this number according to the Jenk method of optimisation of the natural localisation of intervals.
Cuantil intervals: The number of intervals are specified and the sample is divided into this number but gathering into groups values according to their order. Number of intervals: Should indicate the rank or interval number which defines their classification.
- Nº of intervals: Type in the nº of intervals to be represented.
- Initial and final Colour: Select the colours that will be used to graduate. The initial colour for lower values and the final colour for the higher ones.
- Calculating intervals: Once the above options have been defined, click on the “Calculate intervals” button to show the final result. The default symbols and labels that appear can be modified by clicking on them, just as in the previous cases.
- Add: New ranks to the calculations can be added.
- Remove all / Remove: Allows you to delete all (remove all) or some (remove) of the elements which make-up the legend.
Graduated symbols
Represents quantities through the size of a symbol showing relative values.
- Classification field: Choose the numeric field for which the classification is to be made.
- Interval types: The same that are in legend type Intervals
- Symbol: Modify the symbol size with a minimum value (From), to a maximum value (Until). You can also modify all the features of a specific symbol by clicking on the “Template” button, as well as its “background”.
- Calculating intervals: Once the above options have been defined, click on the “Calculate intervals” button to show the final result. The default symbols and labels that appear can be modified by clicking on them, just as in the previous cases.
- Add: New ranks to the calculations can be added.
- Remove all / Remove: Allows you to delete all (remove all) or some (remove) of the elements which make-up the legend.
Proportional symbols
Represents quantities through the size of the symbol which shows exact values.
- Classification field: Choose the numeric field for which the classification is to be made.
Normalisation fields: Possibility of choosing a numerical field which normalises the results, maintaining the proportion of quantities.
- Symbol: Modify the symbol size with a minimum value (From), to a maximum value (Until). You can also modify all the features of a specific symbol by clicking on the “Template” button, as well as its “background”.
Categorías
Expressions
Shows layer elements according to a certain filtered expression.
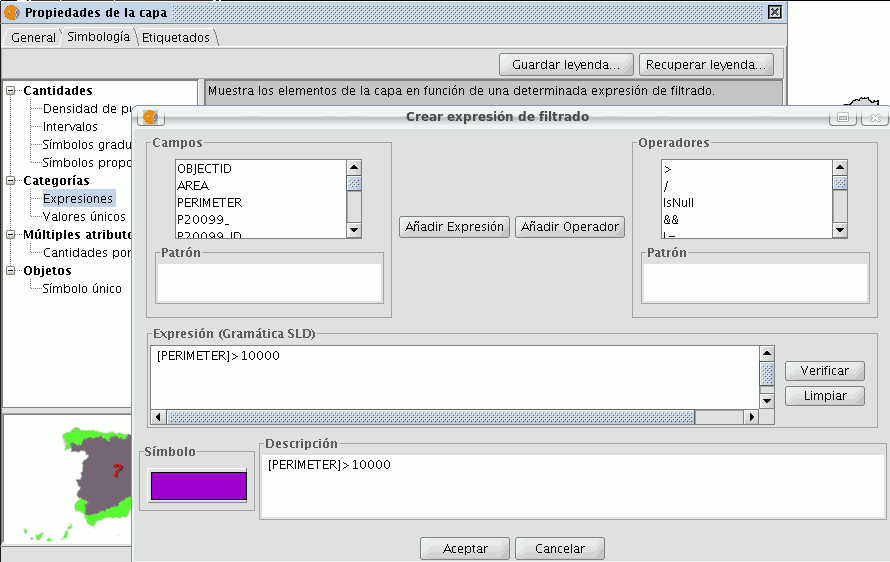
- ''New filtered expression:'' A new window opens where you can configure expressions (filters) upon which a certain symbol will be applied. Each of these will be shown as a row in the main window of this type of legend. The syntax these filters use is SLD.
- ''Modification of filtered expression:''You are able to modify an expression by selecting it.
- ''Delete a filtered expression:''You are able to delete an expression by selecting it.
- ''Up/Down buttons:'' Allows you to move the created expressions up or down so that they later have that order in ToC.
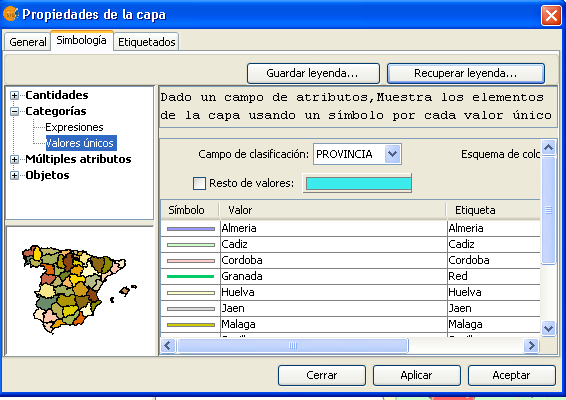
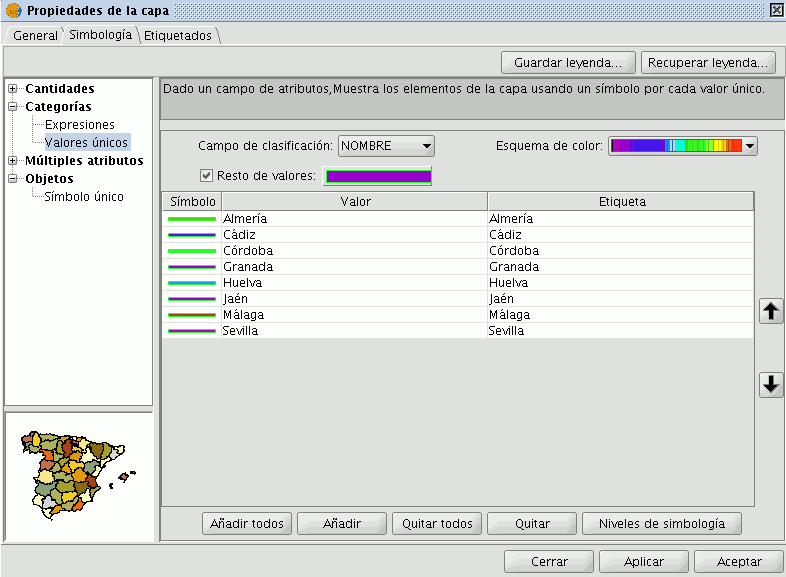
Unique values
Each register can be represented with an exclusive symbol according to the value it adopts in a certain field in the attributes table. It is the most efficient method for spreading categorical data, such as municipalities, floor types, etc.

You will find the following symbology configuration options:
- ''Classification field:''A drop-down menu opens where you can select the layer which contains the data to carry out the classification, in the attributes table field.
- ''Add all/Add:'' Once the “classification field” is selected, all the different values are shown by assigning a symbol (colour) different to each by clicking on the “Add All” button. These symbols can be modified by clicking on them. By default the label (name that appears on the legend) is similar to the value that is adopted by this field. By clicking on “Add” you can add new values to the list.
- ''Delete all/Delete:'' Allows you to delete all (delete all) or some (delete) of the elements that make up the legend.
- ''Symbol properties:'' If you right click on any of the “cells” on the “Symbols” you can modify its properties specifically through the “Select symbol” and “Symbology level” buttons, as well as being able to change the label name in TOC.
Múltiples atributos
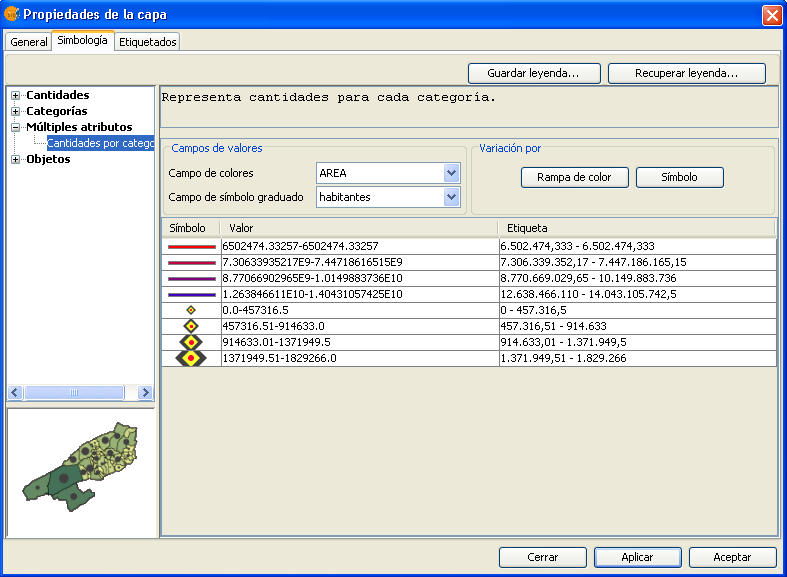
Category quantities
Represents quantities for each category.
For this, it combines two fields (which must be of a numeric type), applying a combined legend made up of colour ramp (for field_1) and specific gradual symbols (for field_2).
Meaning that this type of legend combines a a representation of intervals based on the values of Field_1 with anothier representation of gradual symbols based on the values of field_2.
Objetos
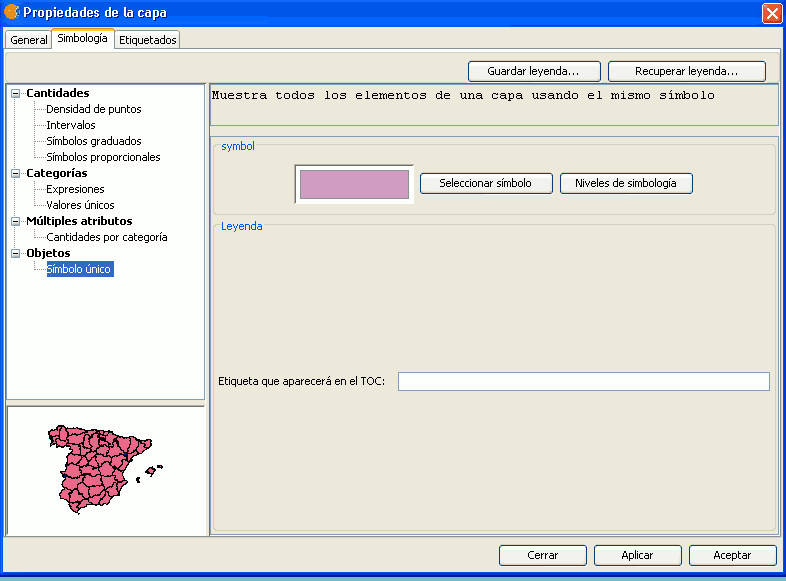
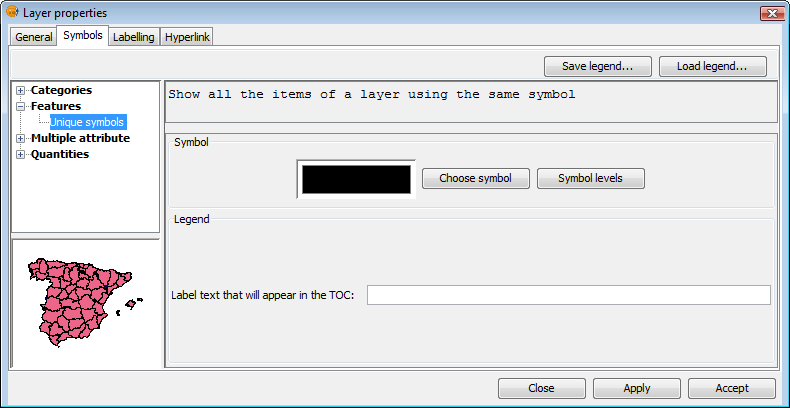
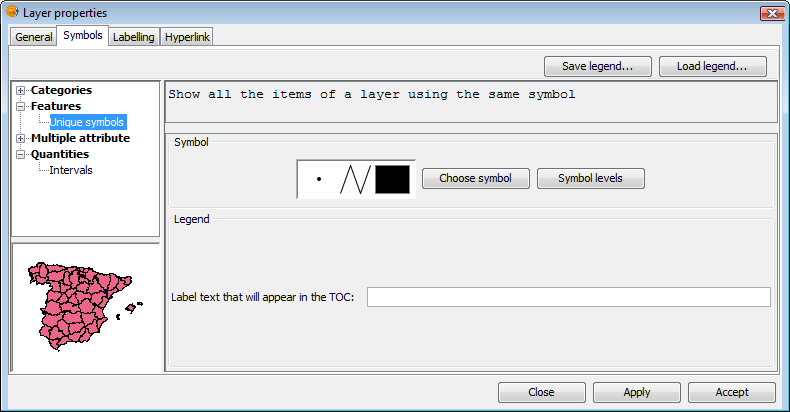
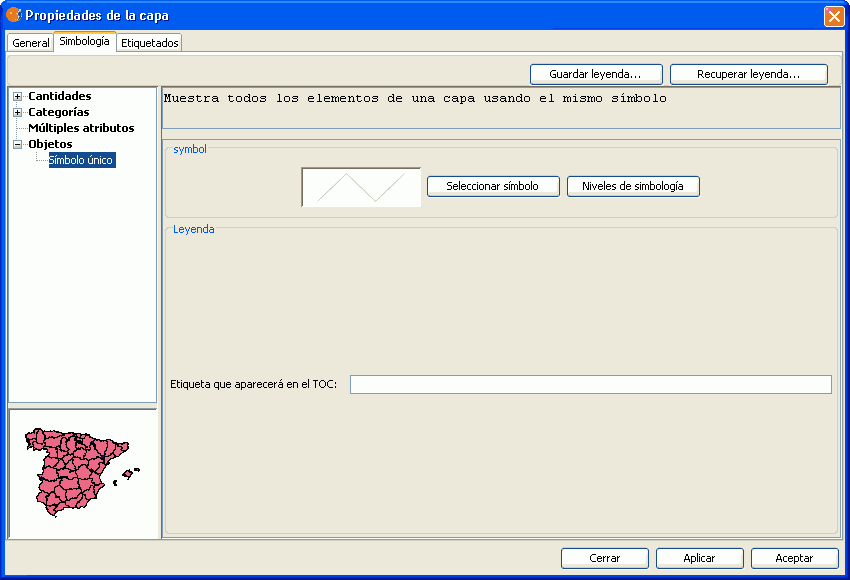
Unique symbol
This is the default gvSIG legend type.
Represents all the elements of a layer using the same symbols. It is useful for when you need to show the location of a layer more than its any other attribute. The representation of its symbology depends on the type of geometry, this is further explained in the symbols section.
Guardar y recuperar leyendas
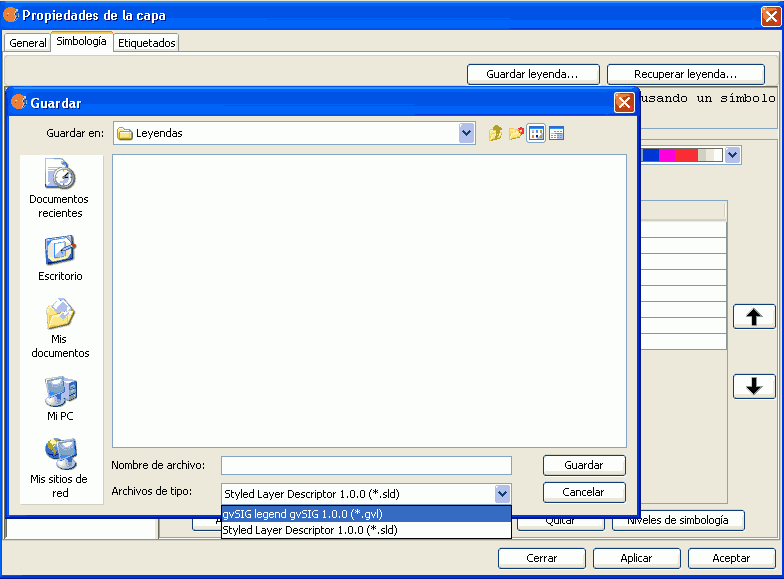
Save legend:
The legends that have been created can be saved so that you can use them on other occasions.
To save, click on the “Save legend” button.
A window will open with the save options: save legend with gvSIV (.gvl) format or standard exchange .sld format (currently supports SDL 1.0.0).
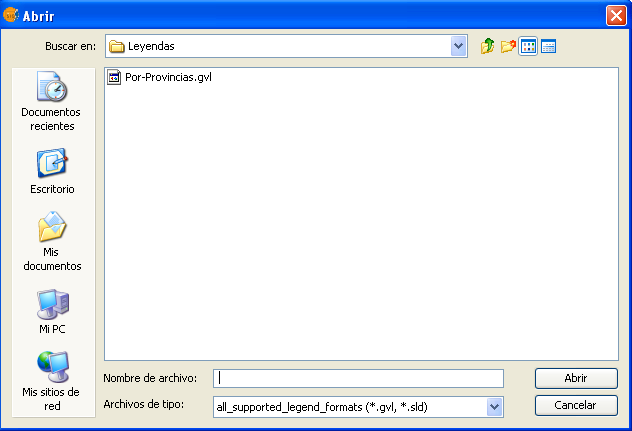
Legend recovery:
Legends that have been previously created can be recovered at any time. Click on the “Recover legend button” and select the legend you want to recover.
Simbología
Introducción
The Symbols tab is used to define advanced features of the legend being worked with.
When creating symbols for a legend it is important point to bear in mind the type of layer the symbols are being created for. This is important because there are two different types of vector layers to consider when making the symbols:
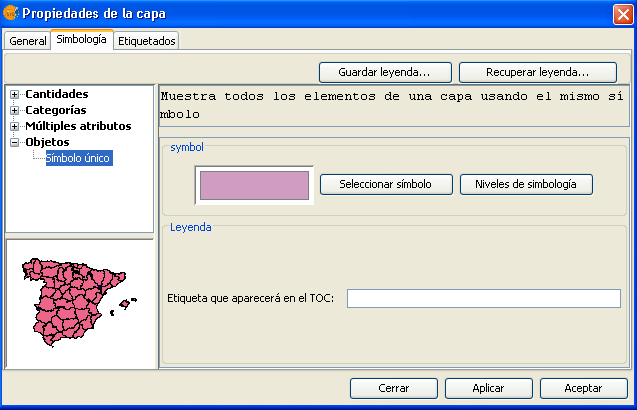
- Single geometry layers: (point, line or polygon shp layers). In this case the Symbols tab allows you to create or edit symbology relevant to the geometry (lines, points or polygons), as shown below:
Single geometry layer
- Multigeometry vector layers, such as dxf, dwg, gml ...
Multigeometry layer
In this case, there is a single Symbols tab where you can configure the symbol properties of the points, lines and polygons separately. Points are configured under the Marker tab, lines under the Line tab, and polygons under the Fill tab.
Tabs corresponding to the symbols for multigeometry layers
With this clarified, we can now look at symbol properties while taking the geometry type into account.
Editor de símbolos
Introducción
From the layer menu, in properties, you can access the Symbology section. It is possible to change or configure a new symbol clicking on “Select symbol” where you will find different configuration options.
Click on the “Select symbol” button and then on the “Properties” button. The window which opens will allow you to edit the properties of the symbol. This is the same window that will open if you click on “New”.
By default gvSIG symbolises the layers with 'unique symbols'.
As well as the basic options that can been seen at first glance, such as colour, breadth and the type of units in which the symbol is to be represented, you can also edit the properties of the element. Next a classification of the properties of an element is made according to its geometry type.
The dialogue boxes that open have common sections and others that are specific to the type of geometry, we see them as follows:
Common characteristics:
When a symbol, is configured from its Properties, be it a point, a line or a polygon, it can be defined:
- Its colour and transparency. Allows the fill-in colour to be chosen.
Under colour you find a scrolling bar, which allows you to play with the grade of the transparency of the elements. This way, you can superimpose polygon layers without interfering with its display.
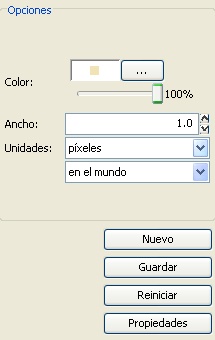
- The breadth of the symbol. Allows you to define the breadth of the element.
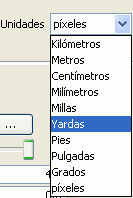
- Units: In this drop-down menu you can chose the type of unit which you want the symbol to be represented in. By default the unit which the symbol will be represented in are pixels, although you can chose between: Kilometers, meters, centimeters, milimeters, miles, yards, feet, inches, grades and pixels.
We can also specify if they are units “on the map” (the size would depend on where the zoom is set) or “on paper” (it will have a set size, both on screen and when it is printed).
- New: Access the properties of the symbols in order to make a new symbol.
- Save: Allows you to save the symbols you have created in gvSIG's library of symbols, with a .sym extension, in order to be able to use them as often as you need and also to configure different types of legends.
- Restart: Click on this button if you wan to restart the editing of a symbol.
Specific characteristics of each type of geometry:
Symbol type:
| Mercator | Lines | Fill-in |
|---|---|---|
| Of character | Simple line | Simple fill-in |
| Simple mercator | Mercator lines | Image fill-in |
| Mercator image | Line image | Mercators fill-in |
| Of character | Simple line | Line fill-ins |
| Of character | Simple line | Gradient fill-ins |
The mercators represent the layers of the points.
The lines represent the linear layers.
The fill-ins represent the polygon layers.
All three together represent the multi-geometric layers.
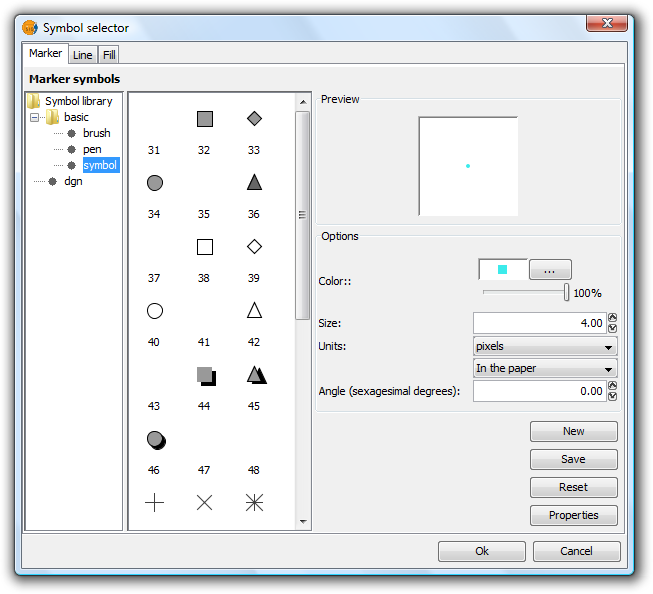
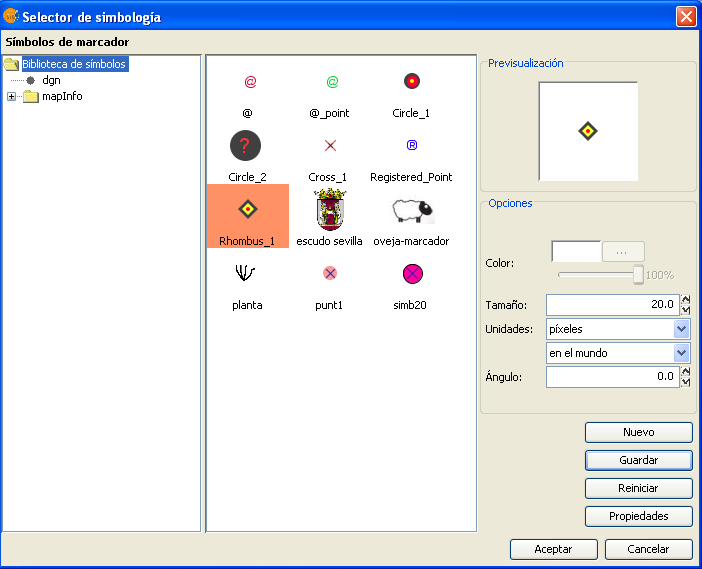
Marcador o símbolo puntual.
You can chose between different Markers that are shown in “Type of Marker”.
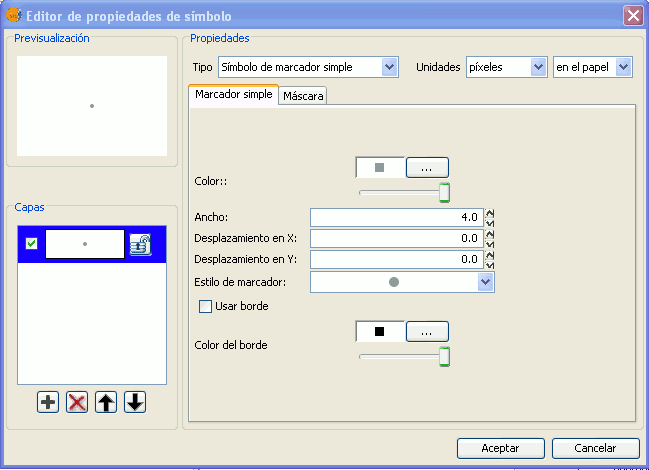
Simple Marker:
In “Marker style”, select the marker (circle, square, cross...). You can modify its size, angle and colour as well as being able to move it around the ordinate and abscissa axis.
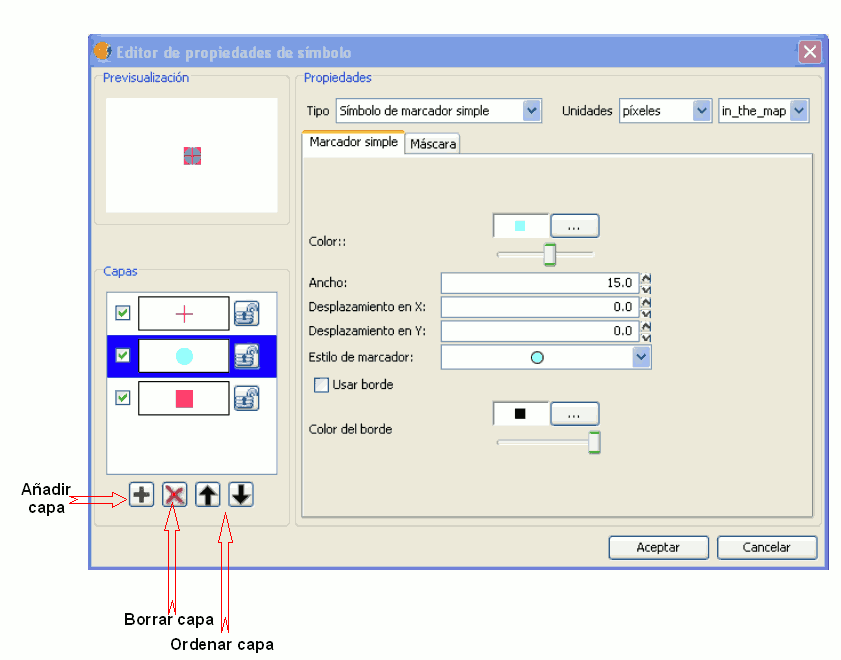
Marker made up of simple markers: you can make up a marker from various other simple markers by “overlapping” one over the other, this is done by clicking on “add layer”, where each layer is a simple marker. You can delete or change the order of the layers by clicking on “Delete layer” or “Tidy layers”. In the following image there is an example of a symbol made up of various simple markers.
You can make the symbols stand out by choosing the colour of the outline and giving it the same transparency as the fill-in of the symbols. To give the symbol an outline you must check the “Use outline” box. You can move the symbol around the ordinate and abscissa axis or leave it in the centre.
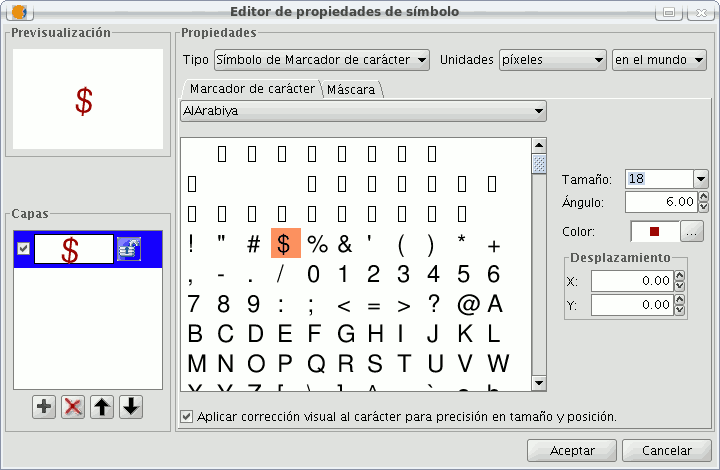
Character marker:
You can use the different alphanumeric character types to create a symbol, you can modify its size, angle and colour as well as being able to move it around the ordinate and abscissa axis.
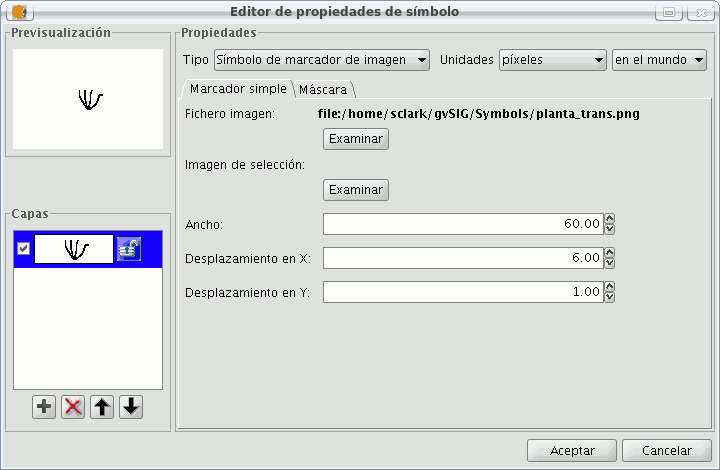
Picture marker:
You can chose whichever image you want to represent the symbol. This image can be in different formats (jpg, png,bmp, svg..., you can even download an image from the internet, as long as the format is supported by gvSIG). To add it just select the path where the image is saved by clicking on “Examine”, next to "Image file".
Also, you have the option of selecting a different image, which is to represent the geometries, when they have been selected and are in view. Do this by entering the path of the image in "Selected image".
You can move the symbol around the ordinate and abscissa axis or leave it in the centre.
Líneas o símbolo lineal
You can choose between different Mercator that are shown in the “Mercator type”.
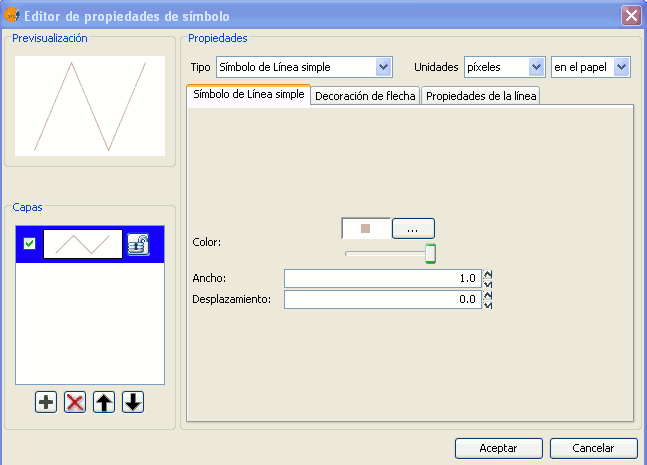
Simple line symbol:
You can choose the colour of the line, its breadth and its movement (offset), as well as having the option to modify its opaqueness and, of course, its measurement units.
As well as that the layers of the points can make up one line with various lines “overlapping” using the same method than which in the layers of points.
In the “Line properties” tab you can generate different types of lines, continuous lines which gvSIG has as default, or discontinuous lines, establishing the fill-in pattern you choose. For this a rule is made available from which you can design your own patterns.
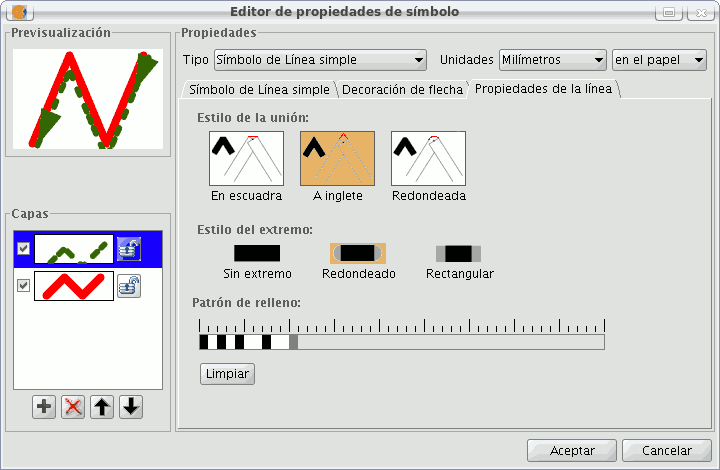
- Fill-in pattern:
Click on the grey section which is on the rule and drag right, next click on the rule, in the rule section you want, and a black section will appear which you can eliminate if you “click” on it again. This way you can successively add sections which can design your line.
If you want to delete the designed line click on “clean”.
- Boarder style: You can chose between round, rectangular or none for the boarder style.
- Style of the union: You can chose between square, angles and rounded for the union of the lines.
In the “Arrow decorations” tab you can turn a line into an arrow. To make this happen check the “Use decoration” box.
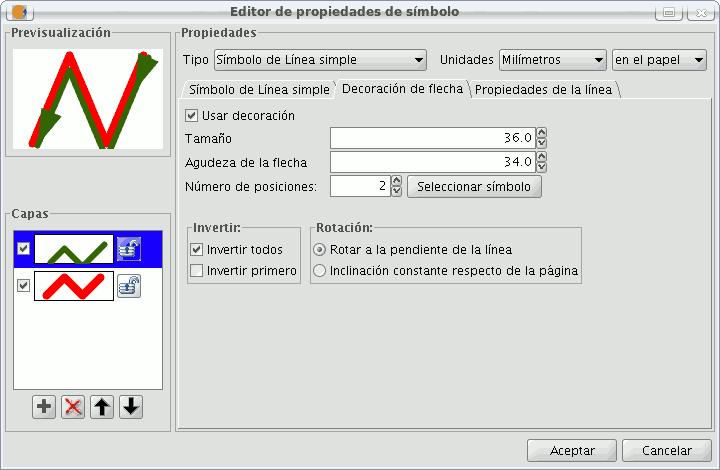
The options available to decorate the arrow are:
- The size of the arrow.
- The sharpness of the arrow.
- Nº of positions: Number of times you want the “point” of the arrow to be repeated along the line.
- Choose Symbol: This button will take you the simple Mercator of a layer of points menu, here you can select the shape of the arrow “point” and configure it as if it were any other symbol.
- Reverse: You have the option of reversing the first or all the arrows from the line.
- Rotation: You can chose between the “point” of the arrow rotates according to the slope of the line or that it has a permanent inclination according to the page.
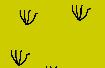
Mercator line symbols:
You can use different font types, such as characters, to create a symbol, modifying its breadth and separation.
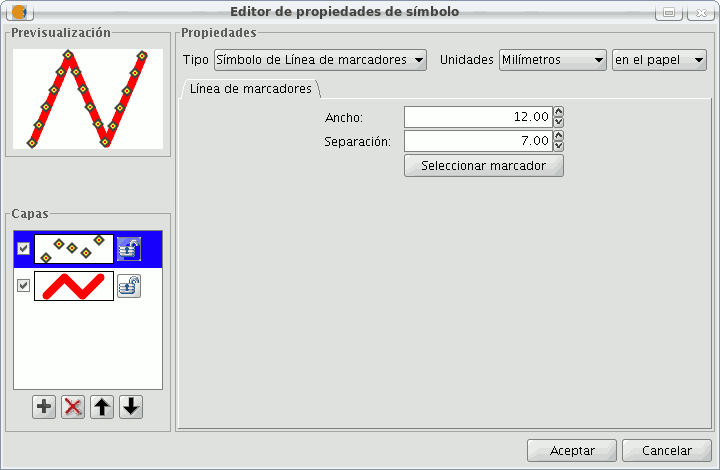
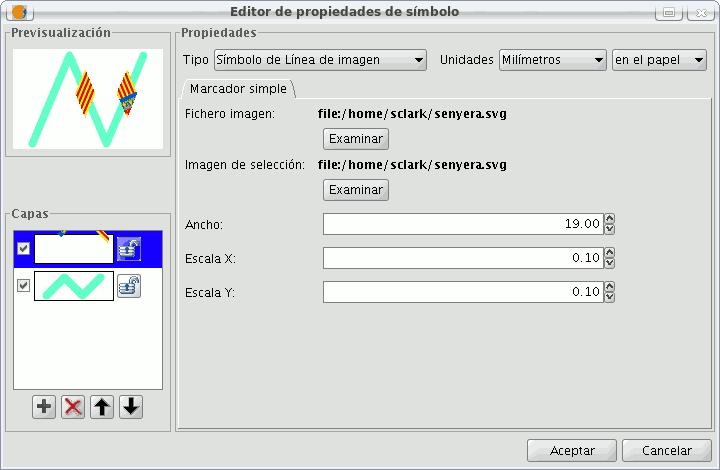
Image line symbol:
You can chose the image you want to make up the line, this image can be in different formats (jpg, png, bmp, svg...). To add the image you only have to select the path to where the image is saved by clicking on “Examine”. You can set the breadth and scale the image in “X” and “Y”.
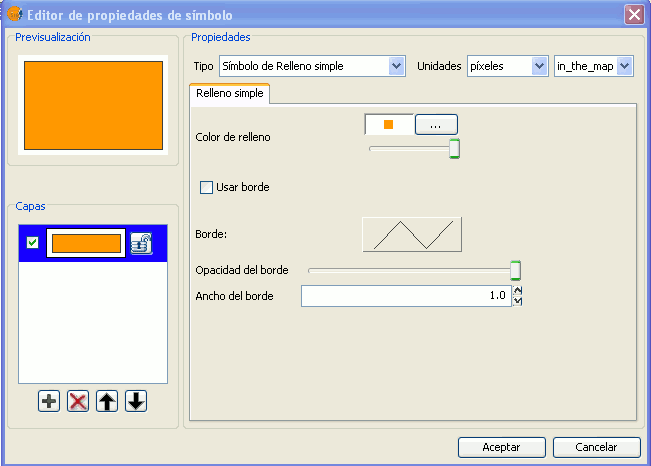
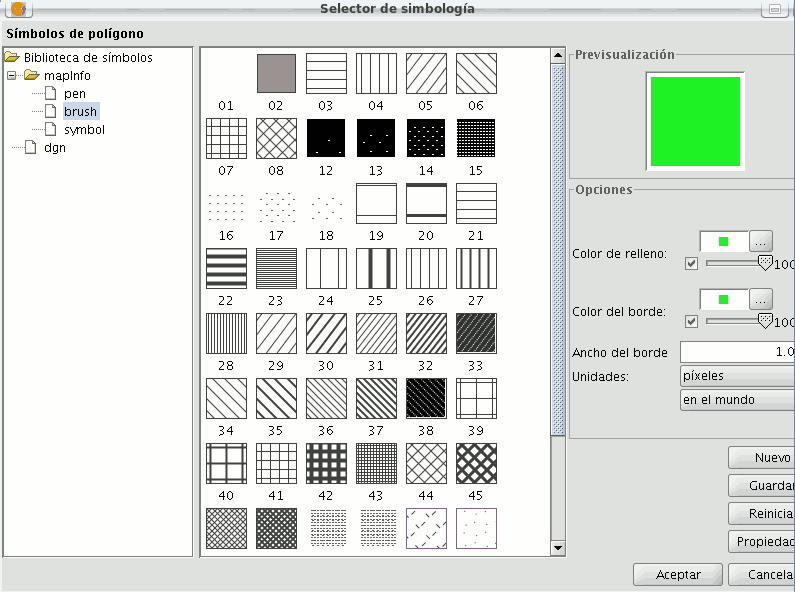
Rellenos para símbolos poligonales
The following fill-in Types for polygonal geometry layers are available.
Simple fill-in:
You can choose the polygon fill-in colour and its opaqueness.
Click on the button where you can see the outline and the simple symbol of a line properties menu will open. Here you can configure the outline of the polygon as if it were a line.
You can give the outline the breadth and opaqueness you want.
Fill-in made up of simple mercators: You can make up a fill-in from various simples by “overlapping” them, it is the same method as that which is explained in the layers of points and lines.
Mercator fill-ins:
You can give the polygon a fill-in made up of different types of mercators, such as punctual, linear, image... with their own characteristics.
The fill-in can be organised in an aleatory way or in a regular mesh way.
There is the option to make compositions with various layers.
Line fill-in:
Instead of filling the polygon in with specific mercators you can do so with lines, you can give them the same properties that you gave a line layer, including the outlines.
As in all sections, here you can also create a composition through different layers.
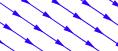
Image fill-in:
You can fill-in the polygon of images and set their inclinations by indicating the angle and you can also scale them.
The way to fill-in the polygon of images is by giving them the specific route to the image. These images can be framed, click on “Outline” and select the line you want.

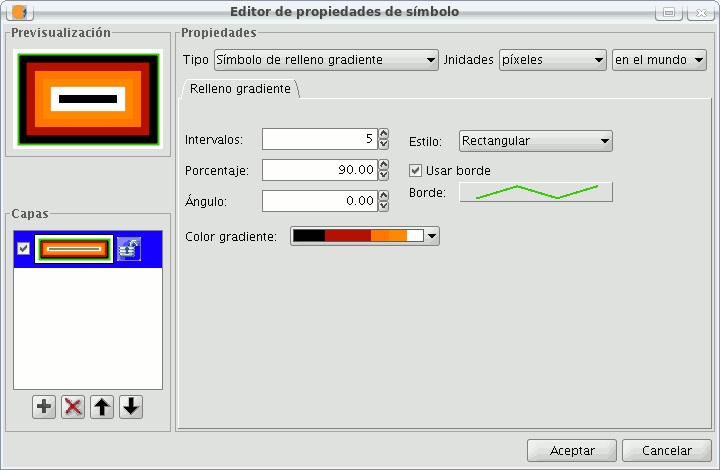
Gradient fill-in:
The possibility of gradually filling-in is available, you can select different options to configure the gradual scale of the colour, these options are:
- Intervals: Nº of intervals you want the gradual changing of the colour to be structured by.
- Percentage: You can chose to set the percentage of gradual change between 0 and 100%.
- Style: Select the style that you want for the fill-in from the drop-down menu.
- Angle: Angle of the fill-in colour.
- Colour gradient: Select the colour scale you want.
- Outline: Give the ploygon an outline, the process of this is the same as if it were a line.
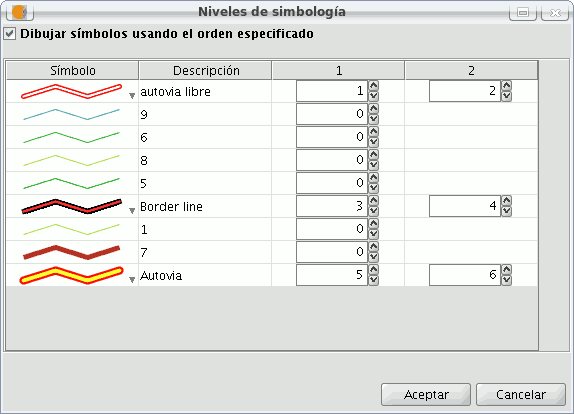
Niveles de simbología
As you can see in the following image, a symbol has two buttons that configure it, “Select Symbol” where you can define its properties, and “Symbology Levels” which allows us to establish the exact order the different layers has created the symbol.
It is important to establish an order when different geometries of the same layer intersect, as can be the case in the unique Value of legends for line layers, for example, where the order established could be of interest so that some symbols are above others.
“0” value corresponds to the symbol drawn at that bottom, “1” is drawn above that and so forth successively.
Etiquetas que aparecerán en el ToC
You can give whatever name you want to the different legend values, to see them in the Table of Contents.
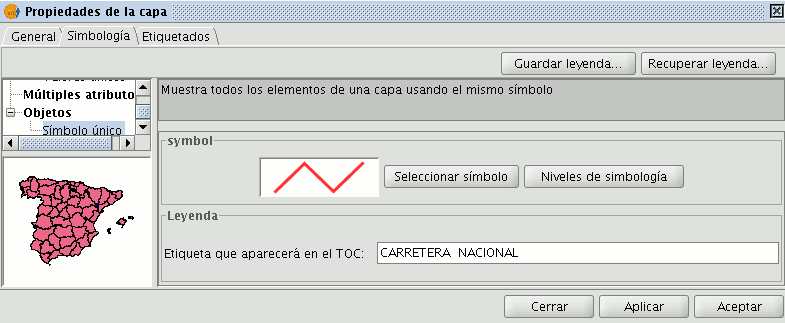
In the previous image we saw a legend by a unique Symbol, but it is also possible to give each of the legend values a label name by Interval, unique Value, etc. (or modify it, from each of the text boxes), as well as being able to modify the order with which theses values appear in ToC (throught the up/down arrows):
Biblioteca de símbolos
Upon installing gvSIC a folder called 'Symbols' is created in the user directory, here you can save different types of symbols (punctual, linear, polygonal...). In other words, it works as a library of symbols. Also, gvSIG includes, by default, a set of symbols from each type of geometry, saving them in the above mentioned folder.
Once a symbol is created, from the “Symbology select” menu, click on “Save”.
A window will open, allowing you to save the symbols on a specific route, inside the “Symbols” folder.
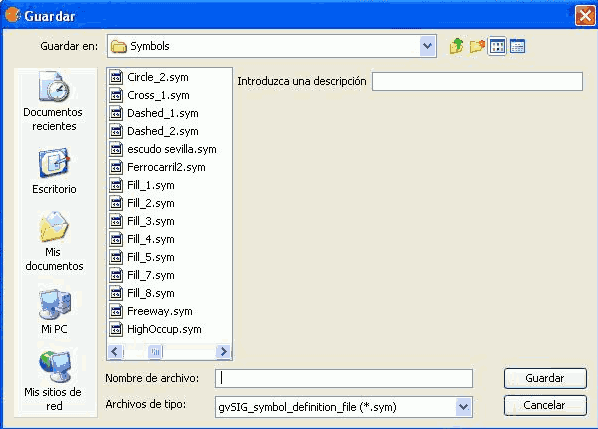
Name the symbol and click on save. Make sure you have saved the symbol as a .sym file and that when you open another layer of the same type of geometry, the library of symbols which has been saved appears.
Etiquetado avanzado
Introducción
Layer labels are an independent property of the legend that draws the layer geometry. For this reason, labels have been separated from the legend and are treated as entities in their own right. The entity containing the layer labels is a level (containing text) that is drawn above all the other layers in the legend. Note that labels only make sense in certain environments, e.g. vector layers, annotation.
Labelling can be accessed via the new 'Labelling' tab in the 'Layer properties' dialog box (to activate the 'Layer properties' right-click on the active layer in the Table of Contents (ToC) and select 'Properties' or else double-click on the layer name).
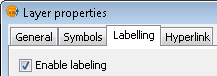
Enable labelling in the Layer properties box
There are two general types of labelling:
1- Static labelling (Using attributes from the layer's attribute table)
2- Advanced labelling (User defined)
To activate labelling the 'Enable labelling' option must be checked.
Etiquetado estático
Static labelling automatically creates labels by using values from an existing field in the layer's attribute table. It has been inherited from gvSIG 1.1 and has almost the same functionality that existed before the implementation of Advanced Labelling in the current version of gvSIG.
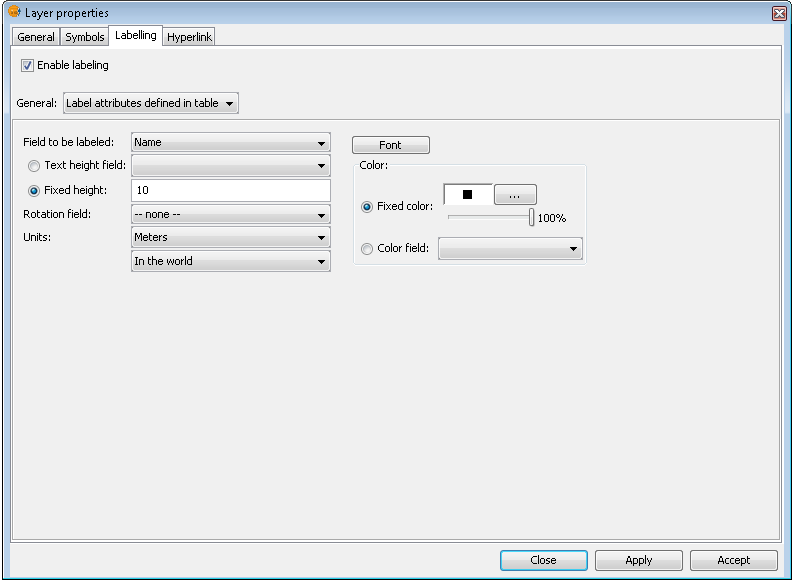
Options for static labelling
These are the options that can be set:
Enable labelling. This enables labelling and displays the layer's labels in the view.
General. For static labelling set this option to 'Label attributes defined in table'.
Field to be labelled. A drop-down list that lets you choose a field in the layer's attribute table that contains values to display as labels.
Text height field option. Select a field in the attribute table that contains the height of each label.
Fixed height option. Enter a fixed value for the size of the labels.
Rotation field. Select a field in the attribute table that denotes the rotation angle of the labels. This must be a numeric field.
Units. Choose the units used for the height values.
Font. Select the font to apply to the labels.
Fixed colour option. Choose a colour for the labels. You can also set the label transparency by using the slider.
Colour field option. Select a field in the attribute table that contains colours.
Etiquetado avanzado (definido por el usuario)
Introducción
User defined labelling provides the user with a great degree of control over the design and placement of labels. It has many more options and is much more powerful than static labelling.
The three different methods of user defined labelling are described below.
Etiquetar todas las entidades de la misma manera
Choose this option to apply the same label style to all features in the layer, regardless of whether they have been selected or not.
The interface for this labelling option looks like this:
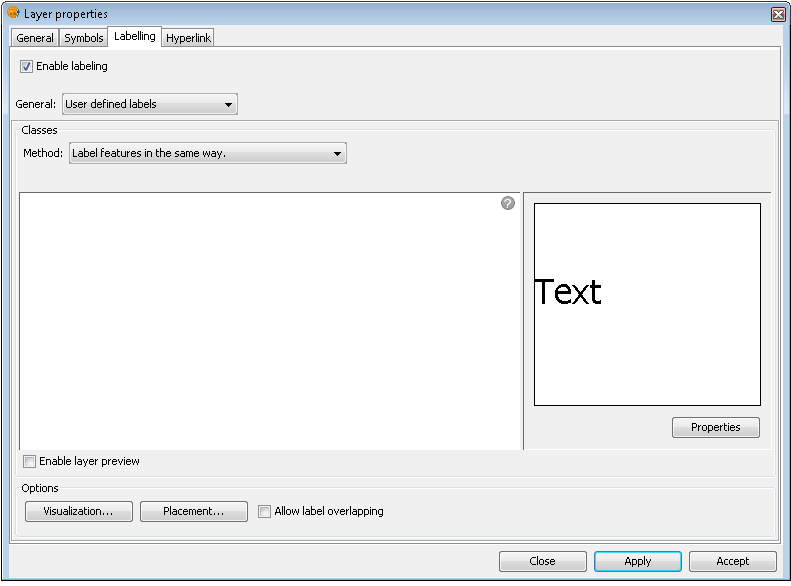
Label all features in the same way
Note the following options, which are explained below:
- Properties
- Visualization
- Placement
It is also possible to preview the labels that have been defined for the layer. These will be applied to the View if the Apply or Accept buttons are clicked.
Etiquetar sólo cuando las entidades estén seleccionadas
Apply the label setting only to those features that are selected in the View.
This labelling is dynamic, so that if the selection in the View is changed, the View is automatically updated with the labels for the new selection.
The interface for this labelling option is the same as that shown above (Label features in the same way).
Definir diferentes clases de entidades y etiquetarlas de manera diferente
With this option the user can create different label classes (through the 'Add' button), assign them a priority for display (using the 'Move up' / 'Move down' buttons to the right of the panel) and label each one separately.
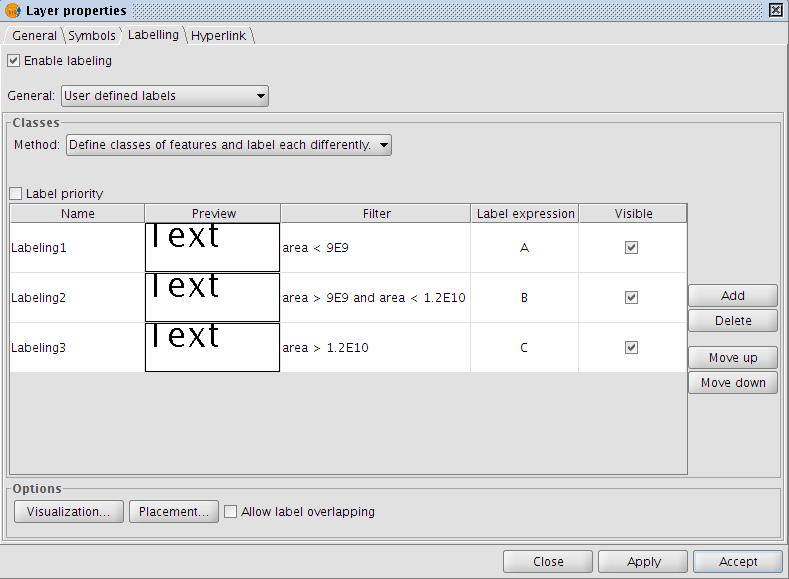
Advanced labelling. Different classes and labelling
The properties for each class can be accessed by double clicking on the relevant class (This brings up a dialog box, which is the same as for the three existing advanced labelling methods).
In other words, the label classes can be configured separately, with different labelling properties and different filters applied to the layer geometry for each class. Keep in mind that the labelling expression uses SLD grammar, while the geometry filter is applied using SQL statements, as defined by GDBMS.
Advanced labelling. Property Configuration
The dialog box below shows how SQL statements can be entered for each of the label classes. These statements act as filters that determine which of the layer's features the class is applied to.
Here is an example of how this SQL filter is used:
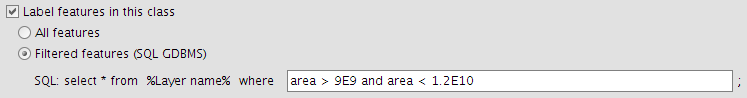
SQL statement for filtering features
Opciones comunes
Introducción
Regardless of which advanced labelling method is chosen, there are some options that are common to all three methods. These options provide a great degree of control over the configuration of the labels.
These options are accessible via the buttons on the labelling tab of the Layer properties dialog box and are described below.
Propiedades
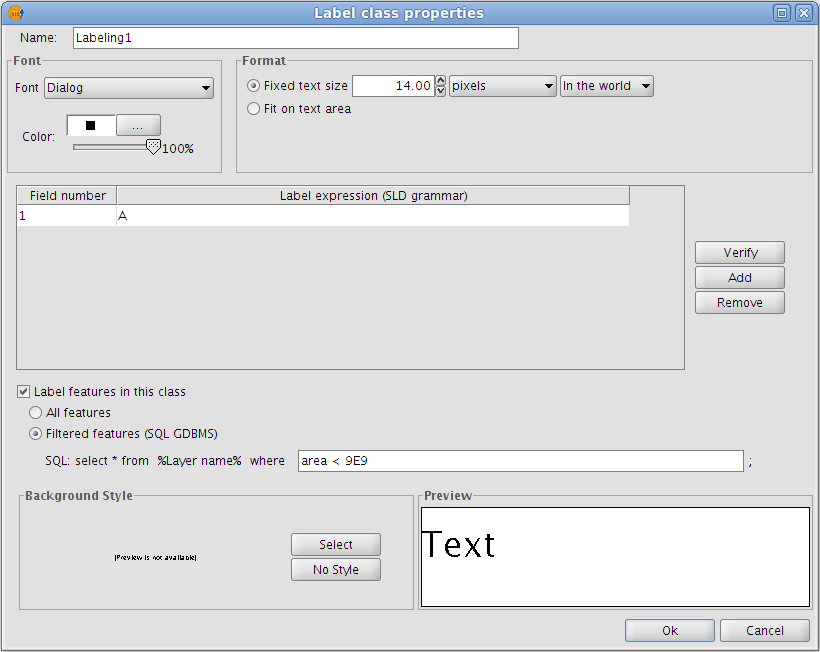
The 'Properties' button provides access to a large number of label options.
Clicking this button opens the dialog box shown in the figure below:
Label class properties
The following properties can be set in this dialog box:
Name
Font type
Font colour
Text size (fixed size or adjusted to fit on text area)
Label expression (one or more)
This is where the actual label is specified. The possibilities are:
- Strings (enclosed in quotes)
- Fields from the attribute table (enclosed in square brackets)
- Mathematical expressions
- Combinations of the above
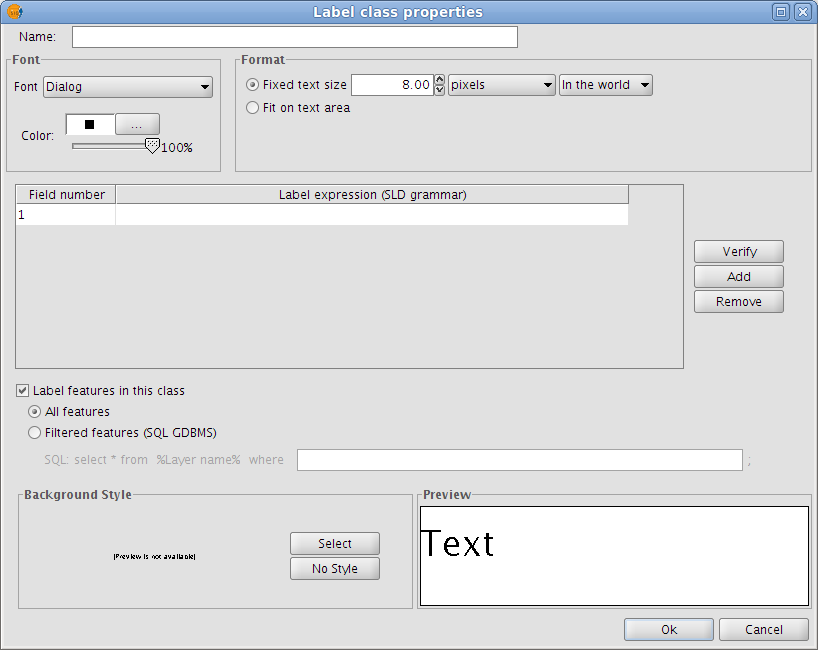
Label all features / filter features with a SQL statement
The SQL filter allows the user to apply the defined label to certain features only.
Background style
Select a style (picture) as a background for the labels. Clicking the 'Select' button opens the following dialog box:
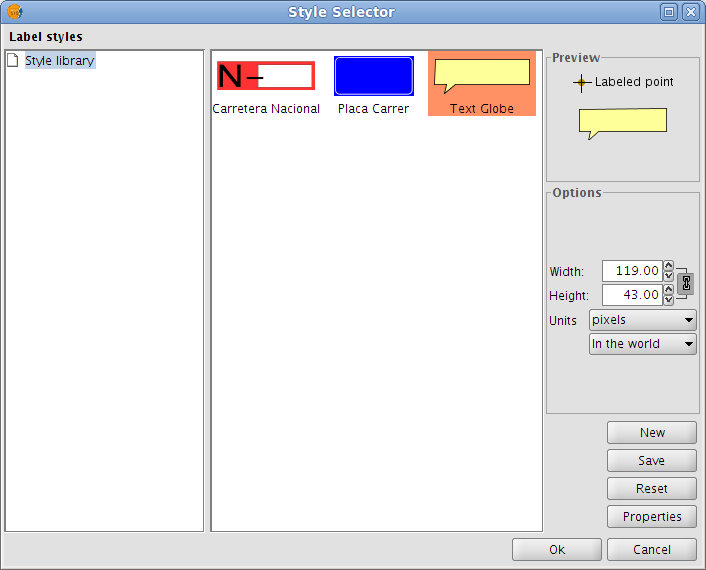
Select a label background style
When gvSIG is installed, the installer automatically creates a directory called 'Styles' in the directory /user/gvSIG/. This is where all the label styles are saved (by clicking the 'Save' button).
Once a label style has been selected, it is possible to modify its properties by clicking the 'Properties' button. This opens a dialog box (shown below) where the user can insert one or more text boxes in which to place the different label expressions that have been created. These text boxes can also be moved or deleted and it is also possible to upload a new image from disk.
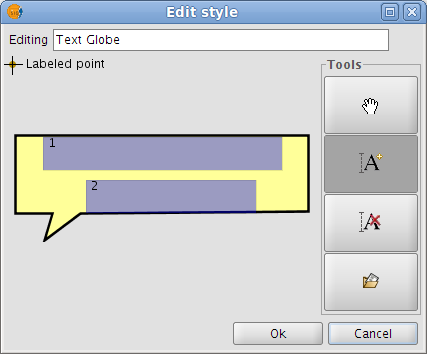
Configure the label background style
Note: It is not possible to apply a background style if the label orientation is set to "Following the line" (see the Placement section below).
Colocación
Clicking the Placement button opens the Placement properties dialog box where the following properties can be configured: location, orientation, duplicates, etc. The options available in this dialog box will depend on the geometry of the layer in question (point, line or polygon):
Point layer
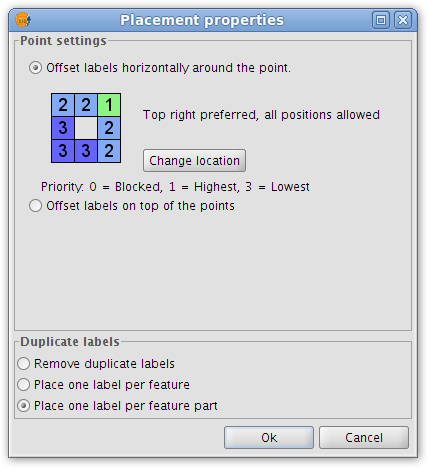
Placement properties for a point layer
If the layer is a point layer, the following options can be configured:
- Point settings
This options allows the user to place the labels on top of the points, or else to offset them around the points.
In the latter case, the label position can be selected from pre-defined placement configurations, which are accessed by clicking the Change location button. This opens the Placement priorities selector from where existing placement styles can be selected. It is also possible to modify a placement style by highlighting it and clicking the Properties button:
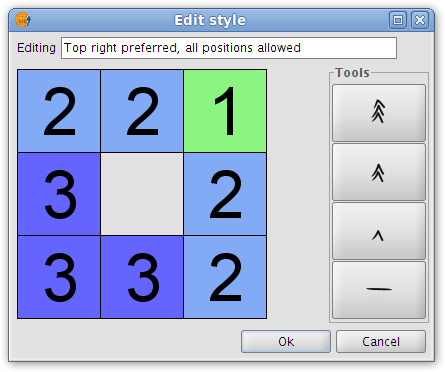
Label priority placement around a point feature
By using the tools on the right and applying them to the location grid on the left it is possible to set the label position priority relative to the point:
1 = High precedence
2 = Normal precedence
3 = Low precedence
0 = Prohibited
- Duplicate labels
Here it is possible to choose between 'Remove duplicate labels' (eliminate any duplicate labels and only draw one label per feature), 'Place one label per feature', and 'Place one label per feature part' (in the case of multipoint features).
Line layer
For line layers the following options are available:
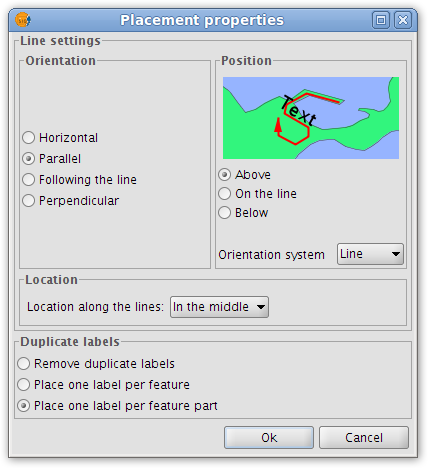
Placement properties for a line layer
- Orientation
The label can be oriented horizontally, parallel or perpendicular to the line, or can be set to follow the line.
- Position
The label can be placed above, on or below the line.
- Location
Place the label at the beginning, middle or end of the line, or at the best position.
- Duplicate labels
The options here are the same as for point layers (described above).
Polygon layer
If the layer is a polygon layer, the Placement properties dialog box provides the following options:
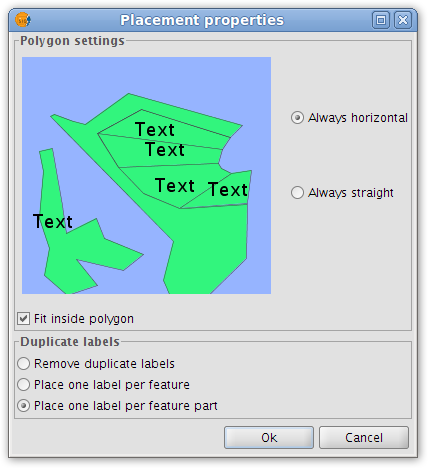
Placement properties for a polygon layer
- Polygon settings
Labels can be set to be always horizontal, or else to follow the orientation of the polygons (always straight). There is also an option for fitting the labels inside the polygons. This last option is used to ensure that labels are placed inside polygons even if they have islands, or are U-shaped.
- Duplicate labels
These options are the same as for point and line layers.
Multigeometry layers
In the case of multigeometry layers (dwg, dxf, gml...) the Placement properties dialog box contains a tab for each of the three geometries (points, lines, polygons). These tabs are identical to those shown above.
Visualización
Clicking the 'Visualisation' button opens a dialog box which allows configuration of the range of scales at which labels will be shown.
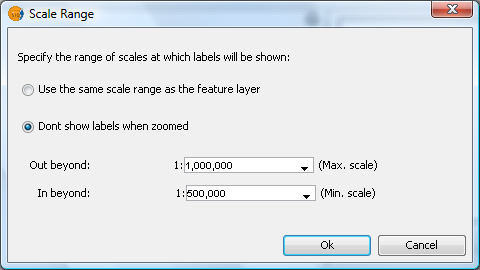
Scale range for a layer's labels
The user can choose to use the same scale range as the feature layer (set under the General tab of the layer properties dialog), or else can specify a scale range at which the labels will be visible (this scale range is independent of the range applied to the geometries of the layer).
In the example shown above, labels in the view are only displayed between the scales of 1:500000 and 1:1000000.
Permitir superposición de las etiquetas
Finally, there is a check box that controls whether labels may overlap or not.
If this box is checked then all labels are drawn, even if they overlap each other. If this box is left unchecked, only non-overlapping labels are drawn and all overlapping labels are eliminated.
Etiquetado individual
In addition to static labelling and user defined advanced labelling, there is a third type of labelling, namely Single Labelling, which can be accessed via the following icon on the toolbar:

Single labelling icon
This type of labelling supplements the existing functionality of annotation layers. In fact, single labelling allows the user to create personalised annotations that have not been possible till now.
The result is an annotation layer, of type shape, plus a file with a .gva extension.
This type of labelling acts only on the geometry that the user has selected in the gvSIG View.
As with advanced labelling, valid label expressions can take on a number of forms:
- Strings
- Fields from the attribute table
- Mathematical expressions
- Combinations of the above
The advantage of Single Labelling over static or user defined labelling, aside from the availability of the many annotation layer labelling options, is that individual labels can be modified and/or moved after they have been created. This is because the labels are in a new, independent layer that can edited just like any other vector layer.
The steps for using this type of labelling are described below:
Configure the annotation properties:
From the main window of this tool, the user can set some basic properties that will apply to the new annotation labels (default annotation properties can be defined in the Annotation properties section of the gvSIG Preferences).
- Font type
- Font style
- Font height
- Font Colour
- Font Rotation
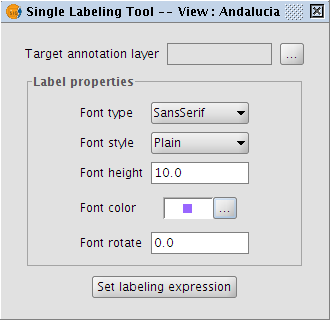
Properties of the annotation being created
Configure the target annotation layer:
As shown in the following dialog box, it is possible to open an existing annotation layer from the hard drive, create a new one in the specified location, or to select one that has already been loaded into the View:
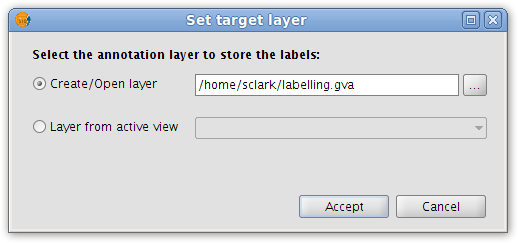
Destination of the annotation layer
Define a labelling expression:
Activate the source layer in the ToC, click the Set labelling expression button and then define an expression in the text box next to the layer name.
An example of this step is shown below:
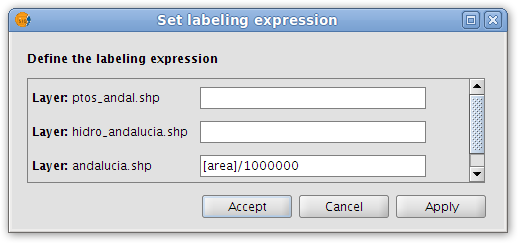
Annotation labelling expression
In the View click on the features that need to be labelled.
In this way, labels are inserted into the View as each of the features is clicked. The labels are drawn according to the label properties set above.
Finally, opening the Layer properties for the annotation layer reveals that a new 'Annotation' tab has been added to the dialog box.
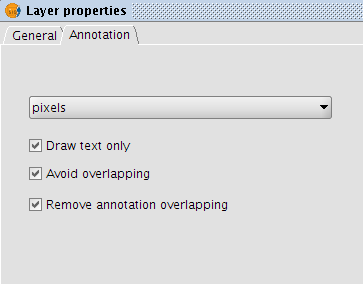
Annotation tab in the Layer properties dialog box
In this tab it is possible to configure a number of annotation options:
- Measurement units (any of the measurement units supported by gvSIG may be selected)
- Draw text only
- Avoid overlapping
- Remove overlapping annotation


